Open topic with navigation
Applying Data Graphics to Shapes in the Model
- Select one or more shapes on the layout that you
would like to apply a data graphic to.
- Click on the desired data graphic in the Data
Graphic window.
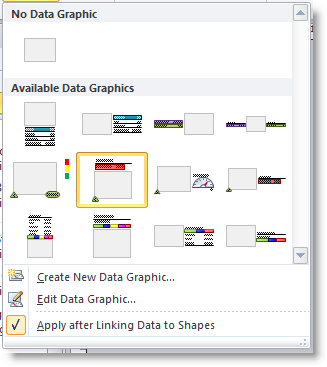
Please note: Hovering
over a data graphic displays a tooltip of its name. Process
Simulator data graphics have descriptive names representing what data
they will display.
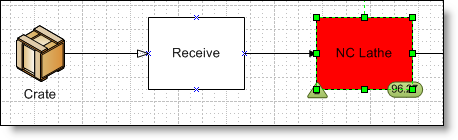
- The
shape(s) on the layout will now have that data graphic applied. In the
example below, a color by value data graphic reveals a high utilization
for the NC Lathe activity.
Removing Data Graphics from Shapes
- To remove Data Graphics associated with shapes,
first select the shape(s) on the layout.
- Next select the None
data graphic type, which is the first one listed in the Data Graphics
window.
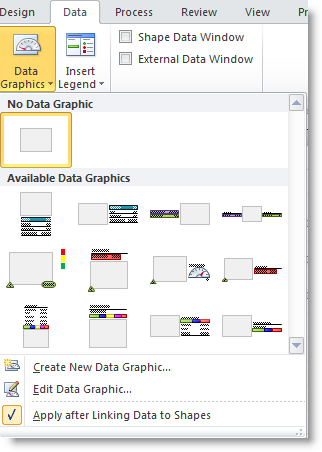
- The data graphics assigned to the shapes are now
removed.
© 2011 ProModel Corporation • 556 East Technology Avenue • Orem, UT 84097 • Support: 888-776-6633 • www.promodel.com